Ocean routes are more than lines across a map. They connect factories, ports, and consumers, while shaping the cost and timing of everyday goods. UNCTAD’s Review of Maritime Transport 2024 reports that seaborne trade grew 2.4% in 2023, reaching 12.3 billion tonnes. The report also underscores shipping’s central role in international trade. Rebeca Grynspan, UNCTAD Secretary-General, has described maritime transport as “the backbone of global trade.” That matters.
This guide examines ten major global maritime trade routes, from Asia–Europe and transpacific corridors to links through the Suez and Panama canals. Their importance reflects cargo volumes, port connections, strategic geography, and the alternatives available when disruptions occur. But a definitive ranking is difficult: route boundaries differ, and public datasets do not always measure the same traffic in the same way. No map is neutral. A busy corridor may be commercially vital yet vulnerable to congestion, weather, or changing canal conditions. The list therefore offers a practical overview, not a permanent league table. It draws on UNCTAD reporting and established trade patterns, while recognizing that route significance can shift quickly. A container ship’s position on a chart tells only part of the story; behind it are schedules, supply chains, and decisions made far beyond the shoreline.
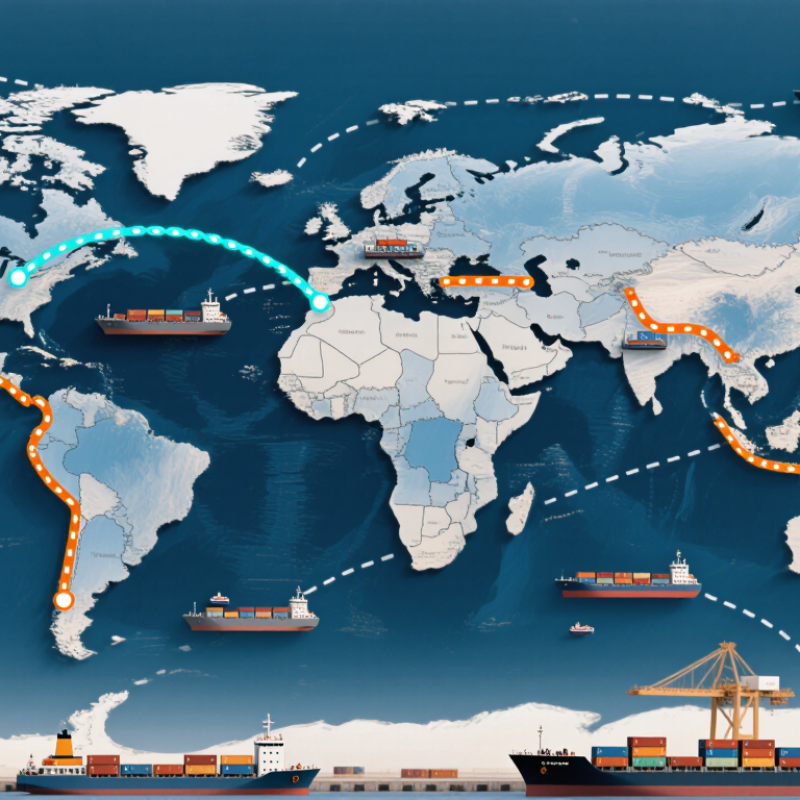
UNCTAD recorded 12.3 billion tonnes of seaborne trade in 2023. That figure describes cargo moved by sea, not its monetary value or the number of ships. A tonne is a measure of mass; it does not show how far cargo travelled. A huge figure.
The total includes very different goods moving along interconnected routes. Picture bulk carriers loading grain, tankers carrying energy supplies, and container ships passing cranes at busy ports. Their journeys link producers, ports, and buyers across regions. One route may carry several cargo types, while a single shipment may pass through multiple ports.
The number gives useful context for global trade, but it does not rank the world’s ten busiest routes. Rankings depend on what is measured: cargo tonnage, container volume, or traffic between specific ports. The distinction matters. Without a stated method, a “top ten” list can imply more certainty than the data supports. UNCTAD’s total is a clear measure of overall scale, not a route-by-route league table. It leaves an important question open.
Global maritime trade depends on a handful of busy container corridors. Three major Trans-Pacific lanes connect East Asian ports with North America: East Asia to the US West Coast, East Asia to the US East Coast, and Southeast Asia to North America. West Coast services often cross the Pacific directly. East Coast cargo may travel through the Panama Canal or continue by rail. The route depends on timing, cost, and final destination.
Asia–Europe traffic includes East Asia to northern Europe, East Asia to the Mediterranean, Southeast Asia to Europe, and South Asia to Europe. Many services pass through the Suez Canal, though port calls and operating conditions shape schedules. A ship may call at several hubs before reaching its destination. Those calls widen access, but add handling time. Maps make routes look tidy. Ports do not always cooperate.
Three major Transatlantic lanes link northern Europe with North America’s East Coast, Gulf ports, and Mediterranean gateways. Together, these ten route segments show how trade corridors connect regional markets, not just two ports. Their rankings can shift with demand, port capacity, weather, and canal access. Trade datasets also define routes differently, so precise comparisons need a stated method. Even experienced planners allow for uncertainty. Schedules slip. The reasons vary.
Gulf–Asia is one of the world’s most consequential maritime corridors. Tankers carry crude oil and other petroleum liquids from Gulf exporters toward major Asian markets, including China, India, Japan, and South Korea. The Strait of Hormuz is its narrow gateway. EIA estimates put oil flows through the strait at about 20.9 million barrels per day in 2023. That is immense. Yet the figure measures oil flows, not every kind of cargo moving along the route.
Intra-Asia shipping links manufacturing hubs, ports, and consumer markets across East and Southeast Asia. Container ships carry components, electronics, and everyday goods between busy terminals. Shorter distances do not mean simple journeys: congestion, weather, and port delays can ripple across supply chains. Small delays matter. Asia–Africa routes add another important connection, moving fuel, machinery, food, and manufactured products between growing markets. Their traffic varies by commodity and season, so a single ranking can hide a lot.
These corridors overlap, and their importance changes with demand, infrastructure, and disruptions at sea. The Hormuz figure is a useful measure of energy dependence, but it cannot describe maritime trade as a whole. A tanker queue or a missed port window makes the network feel less abstract. I may be simplifying a complicated picture; route boundaries are not always tidy.
A qualitative overview of major international maritime corridors. The routes are not presented as a precise ranking: there is no single standard measure of route size across containers, energy cargoes, and bulk commodities.
| Route | Key passages and geography | Typical trade flows | Why it matters |
|---|---|---|---|
| Gulf–Asia | Persian Gulf through the Strait of Hormuz, then across the Arabian Sea and Indian Ocean toward Asian markets | Crude oil, petroleum products, liquefied natural gas, and other energy cargoes | The Strait of Hormuz is a critical energy chokepoint. The U.S. Energy Information Administration estimates that 20.9 million barrels per day of petroleum liquids passed through it in 2023. |
| Intra-Asia | East Asia, Southeast Asia, and South Asia; many services pass through the Strait of Malacca and nearby Singapore Strait | Manufactured goods, components, machinery, chemicals, and regional energy shipments | Connects major production centers, ports, and consumer markets within the world’s largest manufacturing region. |
| Asia–Europe via the Suez Canal | East and Southeast Asia across the Indian Ocean, through the Suez Canal and Mediterranean Sea, then to European ports | Containerized manufactures, machinery, consumer goods, and energy cargoes | Provides a shorter sea route between Asia and Europe than sailing around the southern tip of Africa, although disruption can force diversions. |
| Asia–Europe via the Cape of Good Hope | Asia across the Indian Ocean and around the Cape of Good Hope to Europe | Containerized goods, bulk commodities, and energy cargoes | Serves as an alternative to the Suez route. The longer passage increases sailing distance and transit time. |
| Asia–North America transpacific | East Asia and Southeast Asia across the Pacific to ports on the west coasts of Canada, the United States, and Mexico | Consumer goods, electronics, machinery, vehicles, and agricultural products | One of the principal links between Asian manufacturing hubs and North American markets. |
| Asia–Africa | Asian ports across the Indian Ocean to East, Southern, and West African ports; routes may use the Strait of Malacca or pass south of Africa | Manufactured goods, vehicles, machinery, fuel, minerals, and agricultural products | Links Asian production and export centers with growing African markets and resource-producing regions. |
| North America–Europe transatlantic | Ports on the eastern coast of North America across the North Atlantic to northern and western Europe | Manufactures, vehicles, chemicals, food products, energy, and containerized cargo | Connects two major consumer and industrial regions through dense networks of ocean shipping services. |
| North America–Asia via the Panama Canal | Atlantic-side North American ports through the Panama Canal to the Pacific and Asian ports | Grain, energy cargoes, chemicals, and containerized goods | The canal links the Atlantic and Pacific, often avoiding a much longer voyage around South America. Vessel size and water availability can constrain passage. |
| Black Sea–Mediterranean | Black Sea ports through the Turkish Straits—the Bosporus and Dardanelles—and into the Mediterranean | Grain, crude oil, petroleum products, steel, and other bulk cargoes | Provides the Black Sea’s principal maritime access to the Mediterranean and global ocean routes. |
| South America–Asia | South American Atlantic or Pacific ports across the Atlantic or Pacific, commonly via the Cape of Good Hope or Panama Canal depending on origin and destination | Iron ore, copper, soybeans, other agricultural goods, and manufactured products | Connects major South American mineral and agricultural export regions with Asian industrial and consumer markets. |
Source note: The Hormuz figure refers to petroleum liquids flows in 2023 as estimated by the U.S. Energy Information Administration. Route descriptions are geographic summaries; cargo mix and transit paths vary by port pair and vessel.
Europe–Africa trade moves along several corridors, not one fixed line. Ships crossing the Mediterranean can reach North African ports quickly, while West African services often follow the Atlantic coast. For East Africa, the Suez Canal offers a shorter passage from the Mediterranean into the Red Sea and onward toward the Indian Ocean. Distance matters. So do port capacity, weather, and waiting time at canal entrances.
A practical detail is easy to overlook: a shorter route does not always mean a faster delivery. Congestion, schedule changes, and limited berth space can add days. Cargo owners and logistics teams compare sailing time with reliability, then adjust port calls when conditions shift. The map is only part of the decision.
The Panama Canal links the Atlantic and Pacific, supporting trade between eastern and western parts of the Americas. It can also connect Europe with west-coast South American markets through Atlantic crossings and canal transit. Africa is not directly connected by Panama; cargo moving between Africa and the Americas generally uses Atlantic routes, with the canal relevant when onward Pacific destinations are involved. That distinction matters. These corridors carry everything from refrigerated food in temperature-controlled containers to machinery secured below deck, but their routes and transit times can change with demand, canal conditions, and seasonal constraints.
South America–Asia services carry bulk commodities across some of the world’s longest sea legs. Brazilian grain and mineral exports move east around the Cape of Good Hope, while west-coast South American cargoes can travel across the Pacific. The route depends on origin, vessel size, and port calls. There is no single pattern. A detour can add days, so schedules and cargo buffers matter.
UNCTAD’s Review of Maritime Transport 2024 projected maritime trade growth of 2% in 2024, with containerized trade growing 3.5%. Those forecasts underline the value of reliable links between South American ports and Asian demand centers. Still, forecast growth does not mean every port or commodity benefits equally. Port capacity and seasonal peaks complicate the picture.
Intra-European links complete the network at a finer scale. Short-sea vessels connect major ports with smaller coastal terminals, carrying containers, vehicles, and bulk cargo. Eurostat reported about 1.7 billion tonnes of EU short-sea freight in 2022, around 59% of total EU maritime freight. The measure also includes nearby non-EU partners, so it is not a pure count of intra-European trade. Small connections matter. A missed feeder sailing can leave cargo waiting beside cranes and stacked containers, even when the main ocean route runs smoothly.


